What is GDP ranking by prefecture?
GDP Ranking by Prefecture as of August 2021 is a ranking of GDP data by prefecture and regional blocs based on Cabinet Office data released in August 2021.
GDP is an estimate of the economic scale, industrial structure, and income level of a prefecture by comprehensively and systematically grasping the value added generated by economic activities in the prefecture from the three perspectives of production, distribution, and expenditure.
On this page, you will find two sets of data: GDP rankings by 47 prefectures and by seven regions. Please check which prefectures are rising and which are falling in the regional blocs but rising only in this prefecture.

Check which areas are growing in the GDP ranking by prefecture
In Local Guide Biz, we have introduced “47 Prefectures Ranking of Japanese and Foreign Visitors to Japan” and “Population, Growth Rate, and Gender Ratio Ranking by Prefecture” as part of its efforts to distribute various information on each prefecture. Now, by creating information on the GDP of each prefecture, we will further deepen the information on the economic scale and industrial structure of each prefecture and introduce it in Local Guide Biz for each region.
Prefecture GDP and Growth Rate Ranking
This data is extracted from the National Accounts (GDP statistics) data released by the Economic and Social Research Institute of the Cabinet Office on August 10, 2021, and real data for the fiscal years 2017 and 2018 are shown in the ranking. The unit of the amount is one million yen, and in the case of Tokyo’s 105,846,421, please think of it as 105,846,421 million yen.
In the table below, the order in which the prefectures are displayed changes when you click on each title or number of years, which are colored in black. Please sort the table in order of highest to lowest numbers to compare the rankings and growth rates.
| Region/Prefecture | 2017 | 2018 | Rate of Change |
|---|---|---|---|
| Knato/Tokyo | 105,370,460 | 105,846,421 | 0.5 |
| Chubu/Aichi | 38,660,060 | 39,399,921 | 1.9 |
| Kinki/Osaka | 38,935,060 | 38,983,106 | 0.1 |
| Knato/Kanagawa | 34,440,153 | 34,681,512 | 0.7 |
| Knato/Saitama | 22,624,208 | 22,739,392 | 0.5 |
| Kinki/Hyogo | 20,703,790 | 20,612,570 | -0.4 |
| Knato/Chiba | 19,869,324 | 20,097,008 | 1.4 |
| Kyshu/Fukuoka | 18,939,538 | 19,101,711 | 0.9 |
| Tohoku/Hokkaido | 18,680,727 | 18,786,721 | 0.6 |
| Chubu/Shizuoka | 16,685,245 | 17,050,875 | 2.2 |
| Knato/Ibaraki | 13,202,590 | 13,436878 | 1.8 |
| 中国・広島県 | 11,429,750 | 11,352,001 | -0.7 |
| KInki/Kyoto | 10,422,207 | 10,356,420 | -0.6 |
| Tohoku/Miyagi | 9,215,952 | 9,255,999 | 0.4 |
| Knato/Tochigi | 9,042,333 | 9,081,920 | 0.4 |
| Tohoku/Nigata | 8,652,972 | 8,755,330 | 1.2 |
| Knato/Gunma | 8,564,875 | 8,659,842 | 1.1 |
| Chubu/Nagano | 8,219,768 | 8,396,163 | 2.1 |
| Chubu/Mie | 8,033,862 | 8,261,980 | 2.8 |
| Chubu/Gifu | 7,495,195 | 7,686,791 | 2.6 |
| Tohoku/Fukushima | 7,569,191 | 7,594,938 | 0.3 |
| Chugoku/Okayama | 7,517,032 | 7,546,237 | 0.4 |
| Kinki/Shiga | 6,531,951 | 6,612,171 | 1.2 |
| Chugoku/Yamaguchi | 6,116,028 | 6,158,770 | 0.7 |
| Kyushu/Kumamoto | 5,926,934 | 5,912,739 | -0.2 |
| Kyushu/Kagoshima | 5,340,863 | 5,325,984 | -0.3 |
| Shikoku/Ehime | 4,895,868 | 4,801,130 | -1.9 |
| Chubu/Toyama | 4,484,095 | 4,671,208 | 4.2 |
| Chubu/Ishikawa | 4,532,238 | 4,639,826 | 2.4 |
| Tohoku/Iwate | 4,477,389 | 4,548,239 | 1.6 |
| Kyushu/Nagasaki | 4,424,999 | 4,505,463 | 1.8 |
| Kyushu/Oita | 4,290,527 | 4,408,824 | 2.8 |
| Kyshu/Okinawa | 4,268,675 | 4,334,369 | 1.5 |
| Tohoku/Aomori | 4,300,774 | 4,237,400 | -1.5 |
| Tohoku/Yamagata | 4,192,833 | 4,200,001 | 0.2 |
| Shikoku/Kagawa | 3,749,324 | 3,762,959 | 0.4 |
| Kinki/Nara | 3,579,758 | 3,638,485 | 1.6 |
| Kyushu/Miyazaki | 3,573,188 | 3,609,603 | 1 |
| Chubu/Yamanashi | 3,373,609 | 3,494,004 | 3.6 |
| Kinki/Wakayama | 3,323,838 | 3,439,691 | 3.5 |
| Tohoku/Akita | 3,449,795 | 3,404,560 | -1.3 |
| Chubu/Fukui | 3,258,015 | 3,371,440 | 3.5 |
| Shikoku/Tokushima | 3,057,514 | 3,098,462 | 1.3 |
| Kyushu/Saga | 2,852,646 | 3,031,974 | 6.3 |
| Chugoku/Shimane | 2,402,188 | 2,448,292 | 1.9 |
| Shikoku/Kochi | 2,310,627 | 2,309,519 | -0.0 |
| Chugoku/Tottori | 1,858,316 | 1,867,921 | 0.5 |
| All | 544,897,963 | 549,588,053 | 0.9 |
Aichi Prefecture overtook Osaka Prefecture to take 2nd place in GDP for the first time in 10 years
According to the statistical table (Prefectural Accounts) data released on August 10, 2021 for the period from 2006 to 2018, Aichi Prefecture ranked second after Tokyo with 38.51717 trillion yen in 2007, while Osaka Prefecture was 38.51646432 trillion yen. After that, Osaka Prefecture held the second place until 2017. Then in 2018, Aichi Prefecture reversed the trend for the first time in 10 years to take second place with 39,399.921 billion yen. Osaka was 38,983.106 billion yen. At that time, Aichi Prefecture’s growth rate was 1.9% while Osaka’s was 0.1%. Tokyo had an increase of 0.5%. 1.9% ranks 12th among the 47 prefectures.

The value of manufactured goods shipped in Aichi Prefecture stands out from other prefectures, with transportation machinery (passenger cars, etc.) accounting for 55.3% of the value of manufactured goods shipped, etc. (Outline of Aichi/Industrial Structure)
Saga Prefecture with the highest GDP growth rate in 2018 and Ehime Prefecture with the lowest GDP growth rate
Saga Prefecture is ranked 44th in the Prefectural Accounts (GDP statistics) ranking, but is number one with an increase of 6.3% over the previous year, with an increase of 2.2% in fiscal year 2017. After Saga, Toyama (4.2%) and Yamanashi (3.6%) were the next highest.
On the other hand, the most negative growth in FY2018 was Ehime Prefecture -1.9%. However, in 2017, the growth rate was 2.6%, and in 2016 (1.4%) and 2015 (1.1%), there was also positive growth.

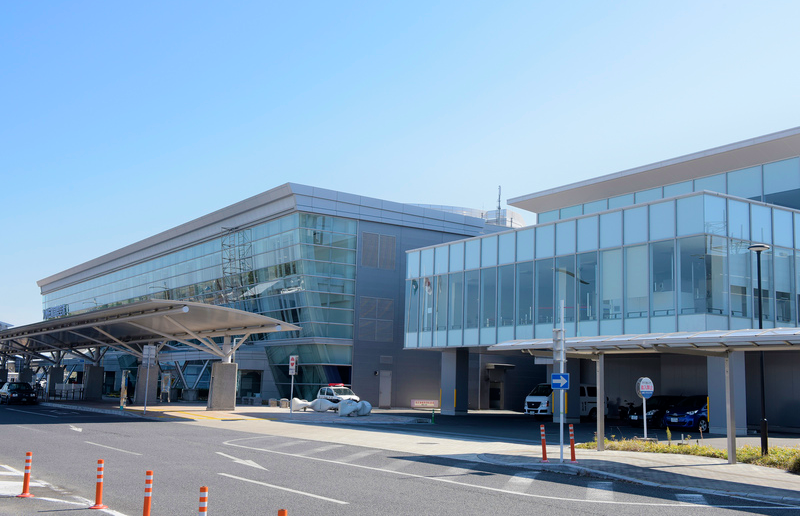
Saga Prefecture’s total production (nominal) is 3,118.4 billion yen, with the manufacturing industry accounting for a large share (25.0%). Its total production value is 778.3 billion yen, with food and other industries accounting for 40% of the total. From the “Summary of Prefectural Accounts for Fiscal Year 2008.” Photo: Kyushu Saga International Airport

Ehime’s total production (nominal) was 4,988.2 billion yen, the first decline in six years. The manufacturing sector saw a 6.0% decrease from the previous year due to declines in pulp, paper, and processed paper products, petroleum and coal products, and transportation machinery, while the finance and insurance sector saw a 4.0% decrease. From the “Fiscal year 2008 Ehime Prefecture Residential Economic Accounts.”
GDP and growth rate ranking of 7 regions
This data is based on the prefectural data above, divided into seven regional blocks (Hokkaido/Tohoku, Kanto, Chubu, Kinki, Chugoku, Shikoku, and Kyushu/Okinawa), and ranked accordingly. The unit of value is 1 million yen. In the case of Kanto’s 214,603,983, please think of it as 214,603,983 million yen.
| Tohoku | Hokkaido, Aomori, Iwate, Miyagi, Akita, Yamagata, Fukushima, Niigata |
| Kanto | Ibaraki, Tochigi, Gunma, Saitama, Chiba, Tokyo, Kanagawa |
| Chubu | Toyama, Ishikawa, Fukui, Gifu, Shizuoka, Aichi, Mie, Yamanashi, Nagano |
| Kinki | Shiga, Kyoto, Osaka, Hyogo, Nara, Wakayama |
| Chugoku | Tottori, Shimane, Okayama, Hiroshima, Yamaguchi |
| Shikoku | Tokushima, Kagawa, Ehime, Kochi |
| Kyushu | Fukuoka, Saga, Nagasaki, Kumamoto, Oita, Miyazaki, Kagoshima, Okinawa |
In the table below, click on each title or number of years in the black color scheme to change the order in which the regions are displayed. Please sort the table in order of highest to lowest numbers to compare the rankings and growth rates.
Japan’s Economy in 2018 – Economic Recovery Continues in Line with Longest Postwar Period
The above data shows that of the 47 prefectures’ national accounts (GDP statistics) for FY 2018, only 8 prefectures and 1 prefecture showed negative growth compared to the previous year, with an overall growth rate of +0.9%.
So how did the Japanese economy and global trends fare in 2018? 2018 saw the Japanese economy recover until it was tied for the longest postwar period, supported by three major drivers: a gradual recovery in the global economy, a growing appetite for capital investment on the basis of high profitability and technological innovation in the corporate sector, and an improving employment and income environment.

In the April-June period, the growth was higher, up 0.7% from the previous quarter, mainly due to an increase in consumer spending and capital investment.
After negative growth in the January-March quarter of 2018 due to a decrease in consumption due to soaring vegetable prices due to unseasonable winter weather, etc., the April-June quarter saw growth of 0.7 year-on-year mainly due to increases in personal consumption and capital investment. % increase, resulting in high growth.
In the July-September quarter, a series of natural disasters caused delays in production and distribution, as well as a decrease in the number of customers. Excluding the impact, moderate growth continued, centered on domestic demand such as consumption and capital investment.
As for exports, demand for smartphones and data centers, which had continued to grow at a high rate, has slowed down, leading to a slowdown in exports of information-related goods. As a result, the underlying trend was flat.
From the Cabinet Office “Japan Economy 2018-2019“.
Hi, my name is Sora and I am a student attending high school abroad. I hope I can do something useful with the skills I’ve gained through living abroad. Thank you! Check out Sora’s profile page here.


