What is the 2021 Population Ranking by Prefecture?
“Population Ranking by Prefecture in 2021” is a ranking of the population, showing the rate of increase and decrease of population, and the gender ratio of each of the 47 prefectures based on the “Population Census Results” and “Population Estimates” from “Statistics of Japan 2021” which is the latest data as of August 2021 provided by the Statistics Bureau of the Ministry of Internal Affairs and Communications.

This site also provides other ranking pages (number of tourist visitors and GDP by prefecture) based on the latest data as of August 2021.
Using the Latest Census Results and Population Estimates as of August 2021
The data used in this Population Ranking by Prefecture is based on the latest data (as of August 2021) and is ranked based on the 2010 (2010) and 2015 (2015) Population Census results and 2019 (2019) Population Estimates.
Population size can affect economic growth (Cabinet Office: Current Situation and Issues Concerning Population, Economy, and Local Communities), and prefectures and municipalities are becoming more and more active in their efforts to promote immigration and settlement. Local Guide Biz would like to pick up and introduce such prefectures and municipalities that are doing their best. In order to do so, we have created this page in order to first find out the population ranking of each prefecture and the rate of increase/decrease in population.
In the table below, the order in which the prefectures are displayed changes when you click on each title or number of years, which are colored in black. You can sort the table in order of increasing or decreasing numbers to see which prefectures are growing or decreasing.
The unit of population in the displayed data is in thousands, so in the case of 13921, please consider it as 13,921,000 people. Percentage change is % compared to the previous year. The data for the gender ratio is the number of males for every 100 females. 96.8 means that there are 96.8 males for every 100 females. The regional blocs are Tohoku for Hokkaido and Kyushu for Okinawa.
Population Estimates for 2019
| Region/Prefecture | 2019 | Wome/Men | Rate of Change |
|---|---|---|---|
| Kanto/Tokyo | 13921 | 96.8 | 7.1 |
| Kanto/Kanagawa | 9198 | 99.4 | 2.4 |
| Kinki/Osaka | 8809 | 92.3 | -0.4 |
| Chubu/Aichi | 7552 | 100.2 | 2.1 |
| Kanto/Saitama | 7350 | 99.6 | 2.7 |
| Kanto/Chiba | 6259 | 98.4 | 0.8 |
| Kinki/Hyogo | 5466 | 91 | -3.3 |
| Tohoku/Hokkaido | 5250 | 89 | -6.8 |
| Kyushu/Fukuoka | 5104 | 89.9 | -0.7 |
| Chubu/Shizuoka | 3644 | 97.3 | -4.3 |
| Kanto/Ibaraki | 2860 | 99.6 | -5.9 |
| Chugoku/Hiroshima | 2804 | 94.5 | -4.6 |
| Kinki/Kyoto | 2583 | 91.5 | -3.1 |
| Tohoku/MIyagi | 2306 | 95.5 | -4 |
| Tohoku/Nigata | 2223 | 94.1 | -10 |
| Chubu/Nagano | 2049 | 95.3 | -7 |
| Chubu/Gifu | 1987 | 94.3 | -5.1 |
| Kanto/Gunma | 1942 | 98 | -5 |
| Kanto/Tochigi | 1934 | 99.3 | -6.1 |
| Chugoku/Okayama | 1890 | 92.7 | -4.6 |
| Tohoku/Fukushima | 1846 | 98.2 | -9.8 |
| Chubu/Mie | 1781 | 95.5 | -5.8 |
| Kyushu/Kumamoto | 1748 | 89.5 | -5.3 |
| Kyushu/Kagoshima | 1602 | 88.7 | -7.4 |
| Kyushu/Okinawa | 1453 | 96.8 | 3.9 |
| Kinki/Shiga | 1414 | 97.8 | 1.1 |
| Chugoku/Yamaguchi | 1358 | 90.5 | -8.8 |
| Shikoku/Ehime | 1339 | 89.9 | -9.3 |
| Kinki/Nara | 1330 | 89 | -6.6 |
| Kyushu/Nagasaki | 1327 | 88.9 | -10.5 |
| Tohoku/Aomori | 1246 | 88.6 | -13.1 |
| Tohoku/Iwate | 1227 | 93.2 | -11.2 |
| Chubu/Isikawa | 1138 | 94.5 | -5 |
| Kyushu/Oita | 1135 | 90.3 | -7.1 |
| Tohoku/Yamagata | 1078 | 93.3 | -11.5 |
| Kyushu/MIyazaki | 1073 | 88.9 | -6.9 |
| Chubu/Toyama | 1044 | 94.3 | -6.6 |
| Tohoku/Akita | 966 | 88.7 | -14.8 |
| Shikoku/Kagawa | 956 | 94.2 | -5.9 |
| Kinki/Wakayama | 925 | 88.8 | -10.5 |
| Kyushu/Saga | 815 | 89.8 | -5.5 |
| Chubu/Yamanashi | 811 | 96 | -8 |
| Chubu/Fukui | 768 | 94.7 | -7.8 |
| Shikoku/Tokushima | 728 | 91.2 | -10.9 |
| Shikoku/Kochi | 698 | 89.3 | -11.5 |
| Chubu/Shimane | 674 | 93.3 | -8.4 |
| Chubu/Tottori | 556 | 91.7 | -8.6 |
| All | 126167 | 94.8 | -2.2 |
Population Data from 2010 and 2015 census
| Region/Prefecture | 2010 | 2015 | Rate of Change |
|---|---|---|---|
| Kanto/Tokyo | 13159 | 13515 | 2.7 |
| Kanto/Kanagawa | 9048 | 9126 | 0.9 |
| Kinki/Osaka | 8865 | 8839 | -0.3 |
| Chubu/Aichi | 7411 | 7483 | 1 |
| Kanto/Saitama | 7195 | 7267 | 1 |
| Kanto/Chiba | 6216 | 6223 | 0.1 |
| Kinki/Hyogo | 5588 | 5535 | -1 |
| Tohoku/Hokkaido | 5506 | 5382 | -2.3 |
| Kyushu/Fukuoka | 5072 | 5102 | 0.6 |
| Chubu/Shizuoka | 3765 | 3700 | -1.7 |
| Kanto/Ibaraki | 2970 | 2917 | -1.8 |
| Chugoku/Hiroshima | 2861 | 2844 | -0.6 |
| Kinki/Kyoto | 2636 | 2610 | -1 |
| Tohoku/Miyagi | 2348 | 2334 | -0.6 |
| Tohoku/Nigata | 2374 | 2304 | -3 |
| Chubu/Nagano | 2152 | 2099 | -2.5 |
| Chubu/Gifu | 2081 | 2032 | -2.3 |
| Tohoku/Gunma | 2008 | 1973 | -1.7 |
| Kanto/Tochigi | 2008 | 1974 | -1.7 |
| Chugoku/Okayama | 1945 | 1922 | -1.2 |
| Tohoku/Fukushima | 2029 | 1914 | -5.7 |
| Chubu/Mie | 1855 | 1816 | -2.1 |
| Kyushu/Kumamoto | 1817 | 1786 | -1.7 |
| Kyushu/Kagoshima | 1706 | 1648 | -3.4 |
| Kyushu/Okinawa | 1393 | 1434 | 2.9 |
| Kinki/Shiga | 1411 | 1413 | 0.2 |
| Chugoku/Yamaguchi | 1451 | 1405 | -3.2 |
| Shikoku/Ehime | 1431 | 1385 | -3.2 |
| KInki/Nara | 1401 | 1364 | -2.6 |
| Kyushu/Nagasaki | 1427 | 1377 | -3.5 |
| Tohoku/Aomori | 1373 | 1308 | -4.7 |
| Tohoku/Iwate | 1330 | 1280 | -3.8 |
| Chubu/Ishikawa | 1170 | 1154 | -1.3 |
| Kyushu/Oita | 1197 | 1166 | -2.5 |
| Tohoku/Yamagata | 1169 | 1124 | -3.9 |
| Kyushu/Miyazaki | 1135 | 1104 | -2.7 |
| Chubu/Toyama | 1093 | 1066 | -2.5 |
| Tohoku/Akita | 1086 | 1023 | -5.8 |
| Shikoku/Kagawa | 996 | 976 | -2 |
| Kinki/Wakayama | 1002 | 964 | -3.9 |
| Kyushu/Saga | 850 | 833 | -2 |
| Chubu/Yamanashi | 863 | 835 | -3.3 |
| Chubu/Fukui | 806 | 787 | -2.4 |
| Shikoku/Tokushima | 785 | 756 | -3.8 |
| Shikoku/Kochi | 764 | 728 | -4.7 |
| Chugoku/Shimane | 717 | 694 | -3.2 |
| Chugoku/Tottori | 589 | 573 | -2.6 |
| All | 128057 | 127095 | -0.8 |
There were No Change in Top 10 Prefecture Population Ranking of 2010, 2015 and 2019
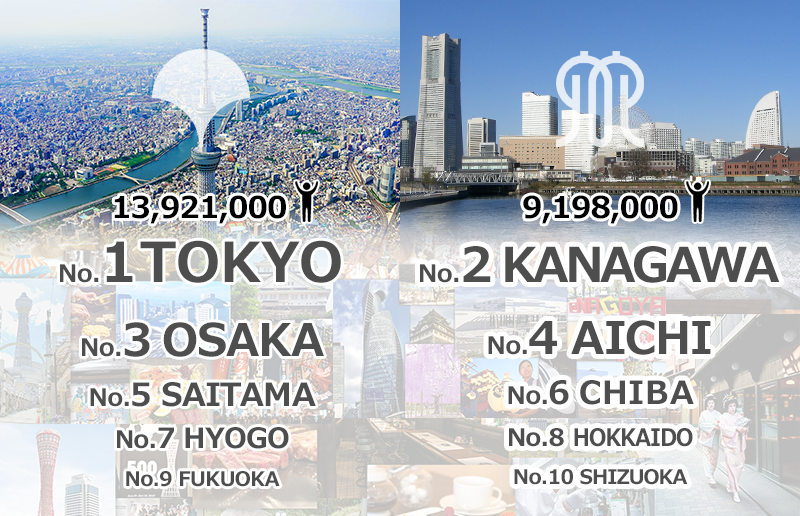
Needless to say, Tokyo (13,921,000) ranked first in terms of population in 2019 before the Corona Virus pandemic, followed by Kanagawa (9,198,000), Osaka (9,198,000), Aichi (7,552,000), Saitama (7,350,000), Chiba (6,259,000), Hyogo (5,466,000), Hokkaido (5,250,000), Fukuoka (5,104,000), and Shizuoka (3,644,000), with these rankings unchanged from 2010, 2015, and 2019. In the regional blocs, the Kanto region accounted for four prefectures, the Kansai region for two prefectures, the Chubu region for two prefectures, and one Tohoku and one Kyushu.
Of the 47 Prefectures, Only Capital City and 5 Prefectures are Experiencing Population Growth
The 2019 percent change (year over year) shows that Tokyo had the largest population in Japan with 13,921,000 people, an increase of 7.1%. Okinawa ranks second with a 3.9% increase and 25th with a 2019 population of 1,453,000. Are there more immigrants to Okinawa or more births? 2019 Okinawa Prefecture Vital Statistics shows that Okinawa Prefecture ranks 1st in the nation in birth rate for 46 consecutive years since 1974. That’s amazing. Okinawa Prefecture is also the prefecture where Japanese spend the most on domestic travel.
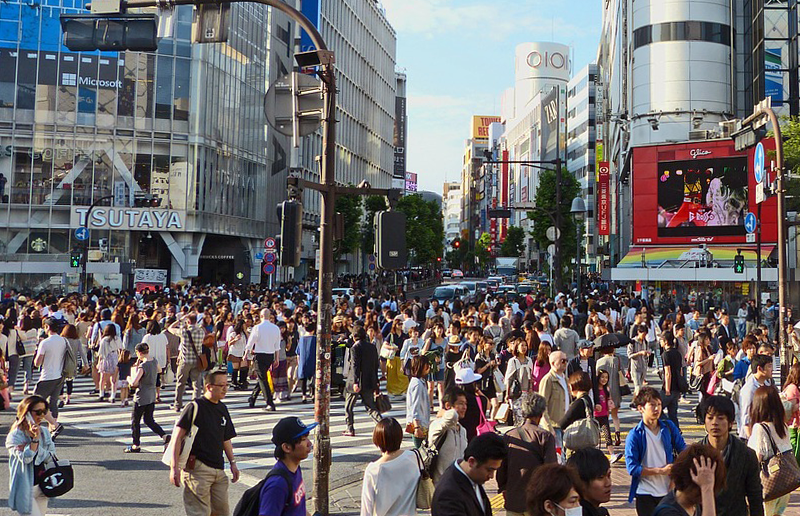
At its busiest, the Shibuya Scramble Crossing sees 500,000 people a day. It is the busiest intersection in the world, with more than 1,000 people moving through it in one crossing.
For more information, please see “Ranking of 47 Prefectures by Japanese and Foreign Visitors to Japan 2019: Comparing Domestic Travel Destinations” in “Japanese Domestic Travel Destinations: Ranking of Prefectures”.
Trends in the two major cities are divergent – Osaka is declining, while Aichi is rising
While Okinawa is followed by Saitama (+2.7%) in third place and Kanagawa (+2.4%) in fourth place, the nearby prefecture of Chiba is in the top seven, with a slight increase of +0.8%. One rank higher than Chiba is Shiga Prefecture (+1.1%), which was ranked 26th in population but is now 6th, actually closer to Okinawa Prefecture (25th) in population. One would like to know what efforts Shiga Prefecture is making. It is disappointing that the prefecture with the top population, Osaka Prefecture, had a slight decrease of -0.3% between 2010 and 2015, and a slight decrease of -0.4% even in 2019. Even large cities differ from Tokyo. Hyogo and Kyoto prefectures in the same Kansai region also saw declines in the -3% range.
Aichi Prefecture in the top 5 is up +2.1%, but Shizuoka Prefecture in the same Chubu region is down -4.3% in 14th place. Elsewhere, we hear that Fukuoka’s population is increasing, but that is only in the cities, and Fukuoka Prefecture as a whole was ranked 9th with a -0.7% decrease. The largest decrease among the top 10 in population ranking was in Hokkaido, -6.8%, and this data shows a wider decrease.
Shiga Prefecture Continues to Grow in Population: +1.1% in 2019, 6th in Terms of Rate of Change
Shiga Prefectural Government Main Building
Shiga Prefecture has launched an emigration portal site as one of its measures to promote emigration and settlement.
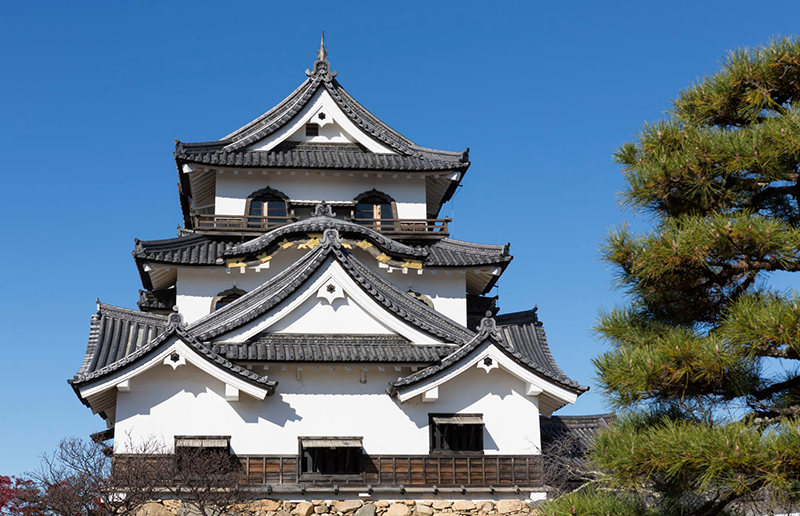
Hikone Castle, Shiga Prefecture
Perhaps the power of Hikonyan is working, Shiga Prefecture is an environment that makes people want to live and continue to live there.
Population by Local Bloc and Rate of Change
This data is based on the prefectural data above, divided into seven regional blocks (Hokkaido/Tohoku, Kanto, Chubu, Kinki, Chugoku, Shikoku, and Kyushu/Okinawa) and displayed in a ranking format. The unit of population in the displayed data is in thousands, and in the case of 43464, please consider 43,464,000 people. Percentage change is the percentage of increase or decrease from the previous year. The regional blocs are Tohoku for Hokkaido and Kyushu for Okinawa.
| Tohoku | Hokkaido, Aomori, Iwate, Miyagi, Akita, Yamagata, Fukushima, Nigata |
| Kanto | Ibaraki, Tochigi, Gunma, Saitama, Chiba, Tokyo, Kanagawa |
| Chubu | Toyama, Ishikawa, Fukui, Gifu, Shizuoka, Aichi, Mie, Yamanashi, Nagano |
| Kinki | Shiga, Kyoto, Osaka, Hyogo, Nara, Wakayama |
| Chugoku | Tottori, Shimane, Okayama, Hiroshima, Yamaguchi |
| Shikoku | Tokushima, Kagawa, Ehime, Kochi |
| Kyushu | Fukuoka、Saga, Nagasaki, Kumamoto, Oita, Miyazaki、Kagoshima、Okinawa |
In the table below, the order in which regions are displayed changes when you click on the respective title or number of years, which are colored in black. You can sort the table in order of highest to lowest numbers to compare the rankings and increase rates.
Among the Seven Regional Blocs, Only the Kanto Region is Experiencing Population Growth
Looking at the data for 2010, 2015, and 2019, only the Kanto region shows an increasing trend. Within the Kanto region, Tokyo (2.7%), Saitama (1.0%), Kanagawa (0.9%), and Chiba (0.1%) prefectures show population increases. The Chubu region, while showing a declining trend in population, shows a decreasing range of decline in this data. On the other hand, the Shikoku and Tohoku regions continue to show declining rates in the 3% range.
Akita, Tohoku, and Shikoku Continue to Show Large Population Declines
Akita Prefecture (38th in population) has the highest rate of decrease at -14.8%. Next is Aomori Prefecture with -13.1%, ranking 31st in population, followed by Yamagata Prefecture with -11.5%, ranking 35th in population. Yamagata Prefecture is next with -11.5%, ranking 35th in terms of population, followed by three prefectures in the Tohoku region. Kochi Prefecture in the Shikoku region is also at -11.5% and ranks 45th in population. Next are Iwate at -11.2%, Tokushima at -10.9%, Nagasaki at -10.5%, Wakayama at -10.5%, and Niigata at -10%, all in double-digit declines. Five of the six prefectures in the Tohoku region are in the top 10 prefectures with double-digit declines… That’s tough.
Miyagi Prefecture, also in the Tohoku region, is in the top 12 in terms of rate of increase/decrease, with a not so large -4% decrease. Miyagi Prefecture is also in the top rank in terms of population, at 14th (2,306,000). The difference between Miyagi Prefecture and other prefectures in the Tohoku region is one of the reasons why the population of Sendai City continues to grow.
Miyagi Prefecture has the Highest Population Ranking in the Tohoku Region, Where the Population Decline has been Significant
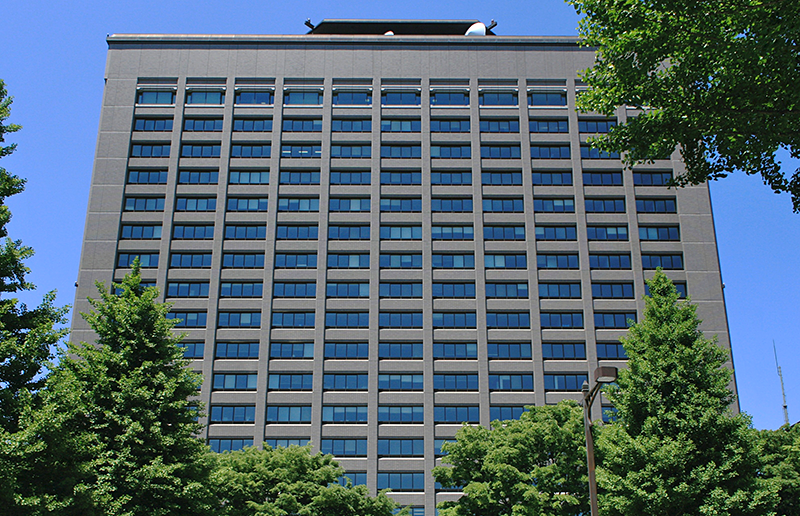
Miyagi Prefectural Office Building
Miyagi Prefecture has launched an emigration portal site as one of its measures to promote emigration and settlement. The population growth rate naturally differs among municipalities, but Sendai City, among others, is experiencing population growth.
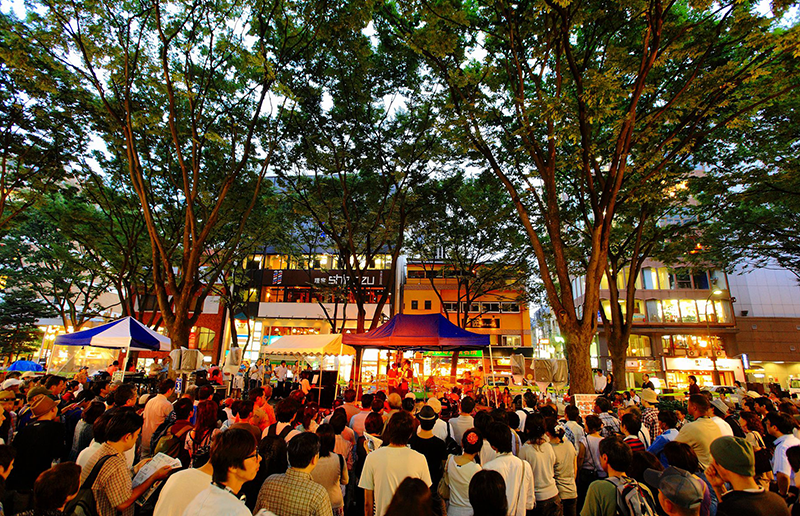
Jozenji Street Jazz Festival
Sendai, the largest city in Miyagi Prefecture, had a population of 1,045,986 at the 2010 census and an estimated population of 1,092,217 on August 1, 2018. The population continues to increase with a rate of change of +4.42.
Population Size Affects Economic Growth – How did the Economy do in 2019?
Before the Corona Virus Pandemic, the global economy in 2019 is reported to have slowed down with repeated downward revisions to GDP growth forecasts. As for the Japanese economy, while external demand (net exports) was weak, domestic demand (personal consumption, capital investment, public demand, etc.) was the driving force behind four consecutive quarters of positive growth since the fourth quarter of 2018. It is said that this may be due to the robustness of the non-manufacturing sector, which is less susceptible to the impact of external demand, supporting corporate and household incomes, and the functioning of a self-sustaining economic virtuous circle around production, income, and spending.

Domestic demand, including personal consumption, capital investment, and public demand, will drive the Japanese economy.
Prefecture's Ranking
GDP is an estimate of the economic scale, industrial structure, and income level of a prefecture by comprehensively and systematically grasping the value added generated by economic activities in the prefecture from the three perspectives of production, distribution, and expenditure. The report also shows the economic scale, industrial structure, and income level of each prefecture. Click here for more information.
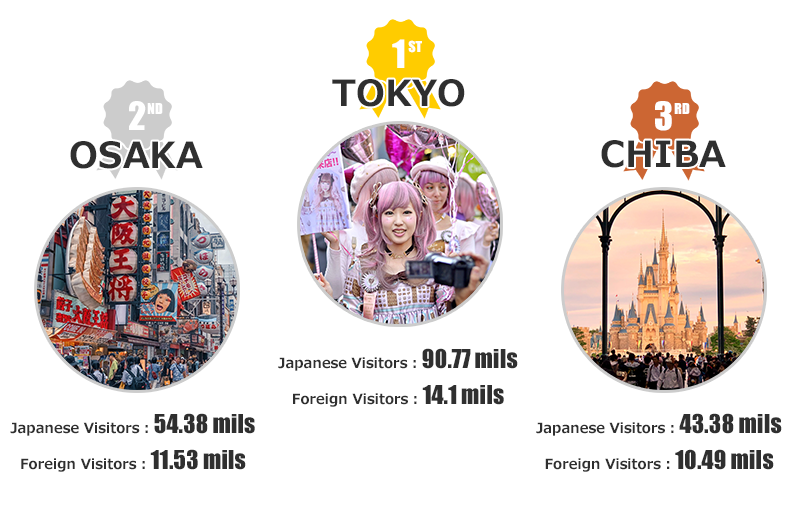
The 47 Prefectures Ranking of Japanese and Foreign Visitors to Japan is a ranking of destinations traveled by domestic residents and destinations visited by foreign tourists in Japan, with the number of visitors for each prefecture. It has been launched in both national and regional areas. Click here for more information.
Let's check the travel destination here!
Hi, my name is Sora and I am a student attending high school abroad. I hope I can do something useful with the skills I’ve gained through living abroad. Thank you! Check out Sora’s profile page here.


